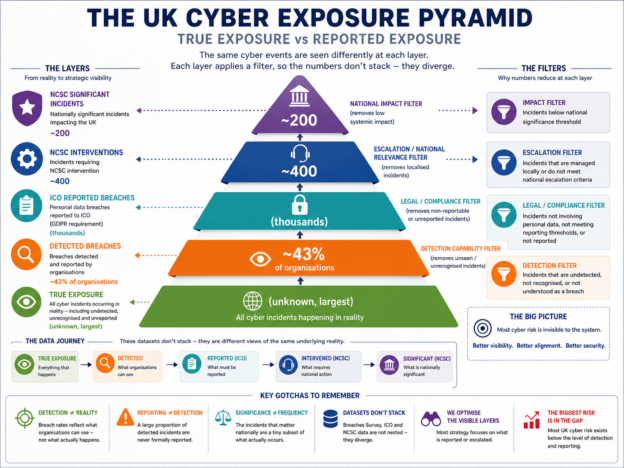
The UK’s cyber security data does not describe a single reality; it describes three filtered views of it. By overlaying Breaches Survey, ICO, and NCSC data, a clearer model emerges: one of layered visibility, not layered severity. This article introduces a “true exposure vs reported exposure” framework, showing that most cyber risk sits below what is detected, reported, or acted on, and that the current strategy is focused on the wrong layer.
Executive Summary
We like to think we understand cyber risk because we have data.
We don’t.
What we actually have are three different systems measuring three different things:
- Organisations reporting what they notice
- Regulators recording what must be disclosed
- The NCSC responding to what is systemically significant
Individually, each dataset is useful.
Together, they reveal something more important:
We are not measuring cyber risk.
We are measuring filters applied to cyber risk.
And those filters don’t align.
This leads to a series of critical “gotchas” that distort how the UK understands its cyber posture:
- Detection ≠ Reality
Breach prevalence reflects what organisations can see, not what actually happens. - Reporting ≠ Detection
A large proportion of detected incidents are never formally reported. - Significance ≠ Frequency
The incidents that matter nationally are a tiny subset of what actually occurs. - Datasets Don’t Stack
Breaches Survey, ICO, and NCSC data are not nested; they diverge. - We Optimise the Visible Layers
Most policy and investment targets reporting and critical infrastructure, while the bulk of activity sits in SMEs and human-factor attacks.
The result is a systemic blind spot:
The majority of UK cyber risk exists in the gap between what happens, what is seen, and what is reported.
This article builds a simple but powerful model to explain that gap, and why closing it is now more important than preventing the next breach.
Contents
- Executive Summary
- Contents
- 1. Introduction
- 2. Three Views of the Same System
- 3. The Problem: These Numbers Don’t Line Up
- 4. Building the Model: Layers of Exposure
- 5. The Key Insight: Each Layer Filters Differently
- 6. The Critical Gap: Detection vs Reporting
- 7. The Second Gap: Reporting vs Significance
- 8. The Emerging Pattern: A Pyramid of Visibility
- 9. What the Model Explains That Surveys Alone Cannot
- 10. The Sectoral Insight: The UK is Optimising the Wrong Layer
- 11. Conclusion: Towards a “True Exposure” Mindset
- 12. Closing Thought: What We Should Measure Next
1. Introduction
There is a fundamental problem at the heart of UK cyber security analysis.
We do not lack data.
We lack alignment between datasets.
- The Cyber Security Breaches Survey tells us what organisations think is happening
- The ICO tells us what organisations are legally required to report
- The NCSC sees what is actually serious enough to matter nationally
Each dataset is valid.
Each dataset is incomplete.
The real insight only emerges when you overlay them.
1.1 The Cyber Breach Series 2026
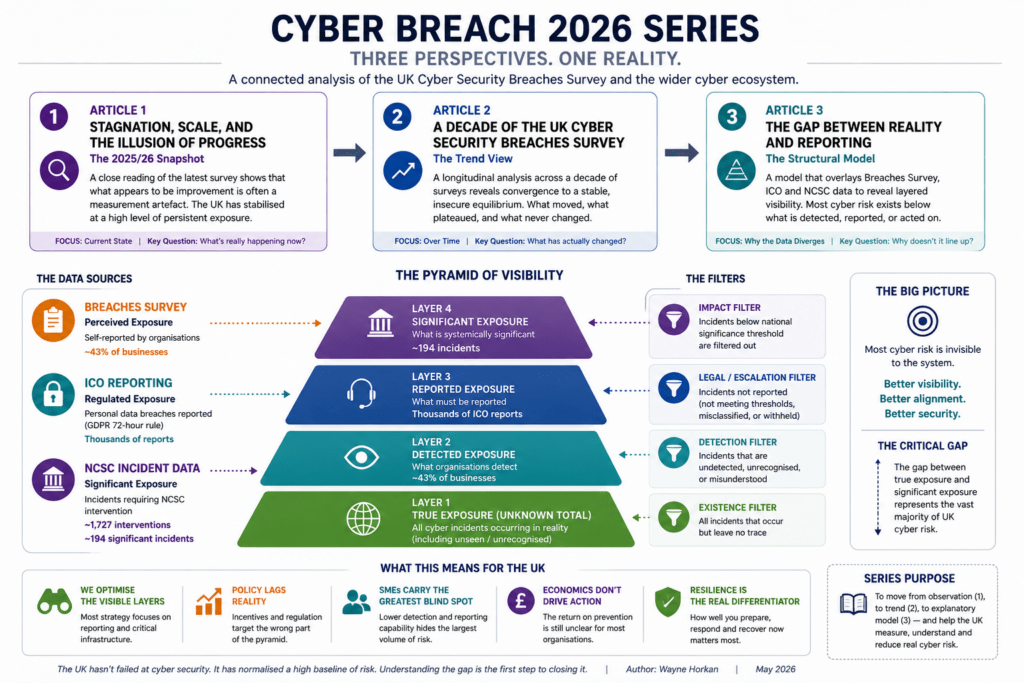
This article forms part of the Cyber Breach 2026 Series, a three-part analysis of the UK Cyber Security Breaches Survey and its wider implications for the UK cyber ecosystem.
Each article approaches the same dataset from a different angle:
- Article 1: Stagnation, Scale, and the Illusion of Progress
A close reading of the 2025/26 survey shows that what appears to be an improvement is, in many cases, a measurement artefact, revealing a system that has stabilised at a high level of persistent exposure. - Article 2: A Decade of the UK Cyber Security Breaches Survey
A longitudinal view across survey releases, identifying the key trends that have shaped the UK cyber landscape, and showing how apparent movement resolves into a stable, insecure equilibrium over time. - Article 3: The Gap Between Reality and Reporting
A structural model that overlays Breaches Survey, ICO, and NCSC data to reveal a deeper issue: that UK cyber risk is not directly observed, but filtered through layers of detection, reporting, and significance.
Taken together, these three perspectives move from observation, to trend, to model, and show that the real problem isn’t just cyber risk.
It’s how we measure it.
2. Three Views of the Same System
Before comparing numbers, it’s important to recognise that we are not dealing with three versions of the same dataset.
We are dealing with three fundamentally different ways of seeing the same system, each shaped by its own constraints, incentives, and blind spots.
2.1 The Breaches Survey (Perceived Exposure)
This is self-reported data:
- Organisations reporting whether they experienced breaches
- Strongly influenced by awareness and detection
- ~43% of businesses report breaches annually
This is perception filtered through capability.
And that matters, because if capability changes, perception changes, even if reality does not.
2.2 The ICO (Regulated Exposure)
This is legally mandated reporting:
- Personal data breaches must be reported within 72 hours under GDPR
This dataset captures:
- Incidents involving personal data
- Incidents that organisations recognise and classify correctly
- Incidents they are willing (or required) to disclose
This is a compliance-filtered reality.
Which means it reflects not just what happened, but what organisations believe meets the threshold to report.
2.3 The NCSC (Systemically Significant Exposure)
This is intelligence-led and intervention-driven:
- ~1,727 incident reports received
- ~429 required NCSC intervention
- ~204 classified as “nationally significant”
This is the tip of the iceberg that actually matters at the system level.
But by definition, it excludes the vast majority of activity happening beneath it.
2.4 No Clear Picture But…
Taken together, these three views don’t give us a clearer picture.
They give us three partial truths, and the challenge is reconciling them.
3. The Problem: These Numbers Don’t Line Up
If cyber risk were being measured consistently, these datasets would form a neat hierarchy.
You would expect them to align, one nested inside the other.
But they don’t.
Instead:
- Hundreds of thousands of breaches estimated annually (survey)
- Thousands of ICO reports
- Hundreds of NCSC interventions
These are not proportional.
They are structurally disconnected views of the same system.
And that disconnect is the signal.
Because it tells us we are not observing a single system, we are observing fragments of it, filtered in different ways.
4. Building the Model: Layers of Exposure
To reconcile these fragments, we need to stop thinking in terms of datasets and start thinking in terms of layers of visibility.
Not all cyber incidents are equal.
And more importantly, not all are visible.
4.1 Layer 1: True Exposure (Unknown Total)
This is the actual number of incidents occurring.
We never observe this directly.
It includes:
- Undetected attacks
- Unrecognised breaches
- Unreported incidents
This is the ground truth and it is fundamentally unknowable in full.
4.2 Layer 2: Detected Exposure (Breaches Survey Proxy)
- ~43% of businesses report breaches
But this depends heavily on:
- Detection capability
- Awareness (especially phishing recognition)
So this layer is:
Reality filtered by what organisations can see
And if visibility improves or declines, this layer shifts accordingly, regardless of what is actually happening underneath.
4.3 Layer 3: Reported Exposure (ICO Data)
- Mandatory reporting within 72 hours for personal data breaches
But only when:
- Personal data is involved
- The breach is recognised
- The organisation complies
So this layer is:
Reality filtered by legal obligation and interpretation
And critically, that interpretation varies, meaning the filter itself is inconsistent.
4.4 Layer 4: Significant Exposure (NCSC Data)
- 429 incidents required intervention
- 204 nationally significant
This is:
Reality filtered by national impact thresholds
It is not about frequency, it is about consequence.
4.5 Parallel Filters Across the Same Data
What this layered view shows is that we are not dealing with a pipeline of data.
We are dealing with parallel filters applied to the same underlying system.
5. The Key Insight: Each Layer Filters Differently
Once you see the system as layered, a critical insight emerges:
These layers are not subsets of each other.
They are different filters applied to different dimensions of the same events.
| Layer | Filter Type | What Gets Removed |
|---|---|---|
| True Exposure | None | Nothing |
| Detected | Capability | Undetected incidents |
| Reported | Legal | Non-reportable or unreported incidents |
| Significant | Impact | Lower-impact incidents |
This creates a compounding effect:
Each step removes a different class of incidents.
Which means:
The datasets don’t “stack”: they diverge.
And once they diverge, simple comparisons between them become misleading.
6. The Critical Gap: Detection vs Reporting
The first major discontinuity sits between what organisations detect and what they report.
Because detection is not the same as disclosure.
Even with GDPR requirements:
- Organisations must recognise the breach
- Classify it correctly
- Decide it meets reporting thresholds
And even then:
- Underreporting is widely acknowledged in cyber datasets
This creates a structural gap:
A large portion of detected incidents never become reported incidents.
And that gap is where much of the system’s hidden risk sits.
7. The Second Gap: Reporting vs Significance
The next discontinuity sits between what gets reported and what actually matters at the national scale.
Because most incidents are not systemic.
They are:
- Localised
- Contained
- Operational
Whereas NCSC involvement reflects:
- National scale
- Systemic impact
- Economic or critical infrastructure relevance
For example:
- 429 NCSC cases vs hundreds of thousands of estimated breaches
This tells us:
Most cyber incidents are noise at system level
but still pain at organisational level
And policy often struggles because it is designed for one layer, but applied to another.
8. The Emerging Pattern: A Pyramid of Visibility
Once these gaps are understood, the overall structure becomes clear.
The UK cyber ecosystem forms a pyramid, not just of severity, but of visibility.
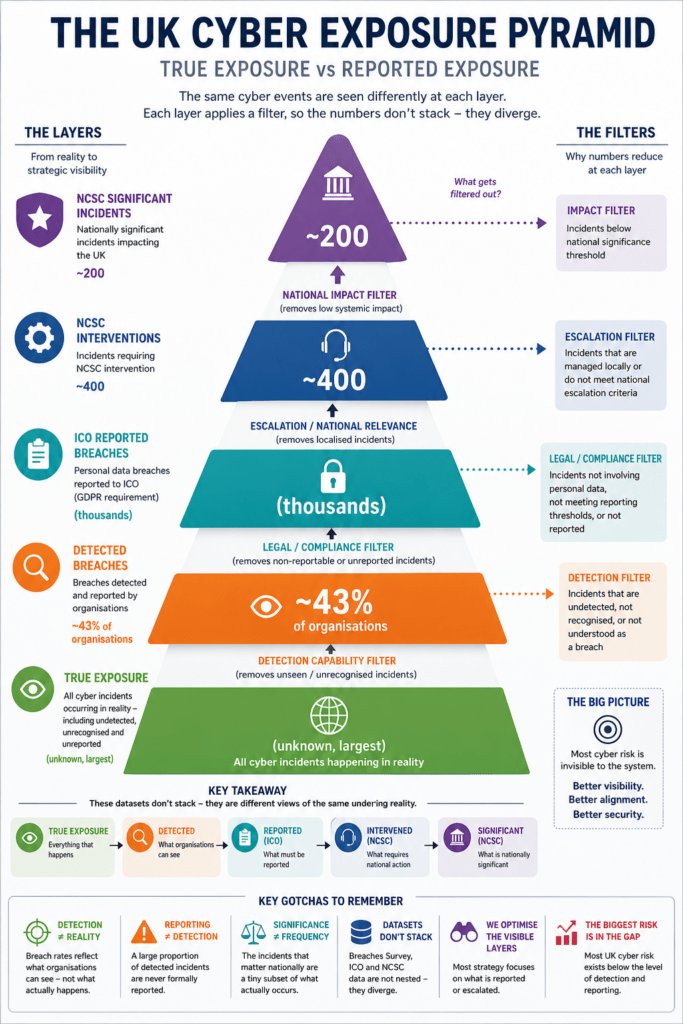
This is not just a model.
It is a map of what we can see… and what we cannot.
9. What the Model Explains That Surveys Alone Cannot
When you view the system through this model, several long-standing anomalies start to make sense.
9.1 Why Breach Rates Stay High
Because detection is improving unevenly, not because attacks are decreasing.
9.2 Why “Serious Incidents” Appear To Increase
Because:
- Reporting improves
- Classification evolves
- Thresholds shift
Not necessarily because reality worsens.
9.3 Why Policy Struggles To Land
Because interventions often target:
- The top of the pyramid (NCSC level)
While most activity sits:
- At the bottom (SMEs, phishing, human factors)
9.4 So The Model Explains…
In other words, the model doesn’t just describe the system.
It explains why the system behaves the way it does.
10. The Sectoral Insight: The UK is Optimising the Wrong Layer
Once the system is understood in layers, a strategic misalignment becomes visible.
Most cyber strategy focuses on:
- Compliance (ICO layer)
- Critical infrastructure (NCSC layer)
But the majority of activity, and vulnerability, is:
- In the detected and undetected layers
This creates a systemic imbalance:
We are optimising for what is visible and regulated,
not for what is most prevalent.
And as long as that remains true, improvements will be partial at best.
This also helps explain the current direction of policy. Interventions are naturally concentrated at the upper layers of the model, reported breaches and systemically significant incidents, because these are the areas where visibility, accountability, and action are strongest.
But the model highlights a deeper challenge: most cyber activity occurs below these layers. As a result, policy is often optimising for what can be seen and governed, while the largest volume of risk remains partially or wholly unobserved. Improving outcomes, therefore, is not just a question of stronger controls but of improving visibility across the system as a whole.
11. Conclusion: Towards a “True Exposure” Mindset
What emerges from this analysis is not just a better understanding of the data.
It is a reframing of the problem itself.
There is no single “cyber risk number” for the UK.
There are only:
- Different lenses
- Different filters
- Different interpretations of the same underlying system
And that system is:
- Larger than reported
- Less visible than assumed
- More structurally consistent than annual surveys suggest
12. Closing Thought: What We Should Measure Next
If the first article showed stagnation,
and the second showed trend convergence,
this third shows something deeper:
We don’t just have a cyber security problem.
We have a cyber observability problem.
The next evolution of the sector won’t come from:
- better tools
- more frameworks
- increased awareness
It will come from:
- Better measurement alignment
- Better cross-dataset modelling
- Better understanding of true exposure vs observed exposure
Because until we can see the system clearly,
we will continue to optimise the wrong parts of it.