The distribution of the 16 Myers-Briggs Type Indicator (MBTI) personality types varies across different populations and samples. It’s important to note that these percentages can change depending on the population being surveyed (e.g., students, professionals, general public) and cultural factors (e.g., Western vs. Eastern cultures).
This article was inspired by my time on the National Cyber Security Centre‘s NCSC for Startups accelerator programme on behalf of Cyber Tzar.
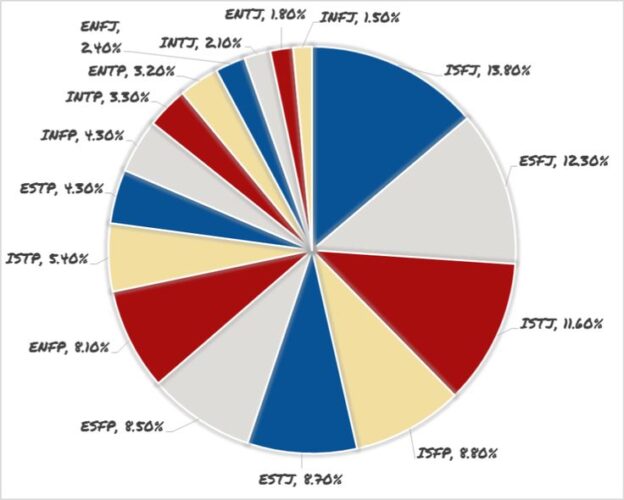
Here are some general estimates based on a sample from the U.S. population:
- ISTJ: 11.6%
- ISFJ: 13.8%
- INFJ: 1.5%
- INTJ: 2.1%
- ISTP: 5.4%
- ISFP: 8.8%
- INFP: 4.4%
- INTP: 3.3%
- ESTP: 4.3%
- ESFP: 8.5%
- ENFP: 8.1%
- ENTP: 3.2%
- ESTJ: 8.7%
- ESFJ: 12.3%
- ENFJ: 2.5%
- ENTJ: 1.8%
The primary source for such data is the “MBTI Manual” published by CPP, the exclusive publisher of the MBTI instrument.
Source: Myers, I. B., McCaulley, M. H., Quenk, N. L., & Hammer, A. L. (1998). MBTI Manual (A guide to the development and use of the Myers-Briggs Type Indicator). Consulting Psychologists Press.
It’s worth noting that different studies might produce varying percentages based on the sample population and methodology. Therefore, while the “MBTI Manual” provides one of the most comprehensive overviews, it’s always a good idea to consult multiple sources and studies to get a holistic understanding.
They may not represent specific subpopulations or cultural groups accurately. Furthermore, the MBTI’s popularity and usage in corporate and educational settings in the U.S. may influence these percentages. Different countries or cultures might have different distributions.