Understanding the fundamental principles of statistical analysis is essential. This guide aims to provide a clear, no-nonsense explanation of the basic concepts of mean, mode, median, range, and average.
Mean: The Arithmetic Average
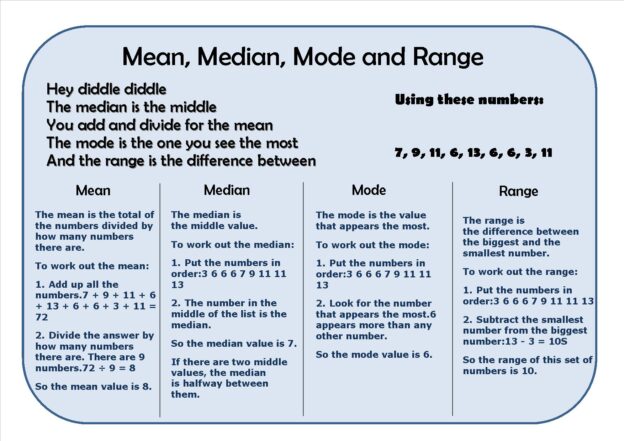
The mean, commonly referred to as the arithmetic average, is calculated by summing all the values in a dataset and dividing this total by the number of values. For example, in a dataset comprising 2, 4, 6, 8, and 10, the mean is calculated as (2+4+6+8+10) / 5, resulting in a mean of 6. This measure is useful for representing a dataset with a single value, offering a sense of the ‘central’ tendency.
Mode: The Most Frequent Value
Mode refers to the most frequently occurring value in a dataset. It is particularly useful in understanding the commonality within a dataset. For instance, in a dataset of 1, 2, 2, 3, 4, the mode is 2. It’s noteworthy that a dataset may have more than one mode (or none at all), depending on the frequency distribution of the values, for instance where two values are as frequent then it is “bimodal”.
Median: The Middle Value
The median is the middle value in a dataset when the values are arranged in ascending or descending order. It effectively splits the dataset into two equal halves. In the dataset 1, 3, 3, 6, 7, the median is 3. If there is an even number of values, the median is the mean of the two central numbers. The median is particularly useful in datasets with outliers or skewed distributions, as it is not affected by extreme values.
Range: The Measure of Spread
The range is a measure that represents the spread or dispersion within a dataset. It is calculated by subtracting the smallest value from the largest value in the set. The range gives a quick sense of the width of the distribution of values.
For instance, consider a dataset containing the values 3, 7, 8, 10, and 15. To determine the range, you subtract the smallest number (3) from the largest number (15). Thus, the range is 15−3=12. This tells you that the span of your data from the lowest to the highest value is 12 units.
The range is particularly useful for understanding the overall variability in a set of data. However, it’s important to note that the range can be heavily influenced by outliers or extreme values. Despite this, it provides a simple and quick way to grasp the extent of variation in any numerical dataset.
Average: A General Term
The term ‘average’ is often used interchangeably with ‘mean’, but it can also refer more broadly to any measure of central tendency, including mean, median, and mode. Its usage depends on the context and the specific characteristics of the data being analysed.
Summary
- Mean is the total sum divided by the count (common ‘average’).
- Mode is the most frequently occurring value.
- Median is the middle value when ordered from lowest to highest.
- Range is the highest minus the lowest.
- Average can refer to mean, median, or mode, depending on the context.
Conclusion
In engineering and other fields requiring data analysis, understanding these statistical measures is crucial for accurate data interpretation and decision-making. Each measure – mean, mode, median, range, and average – provides unique insights into the properties of a dataset, facilitating a comprehensive understanding of numerical data.